I was up designing till 3am. So I built a robot to replace me.
4 July 2026 · 5 min read
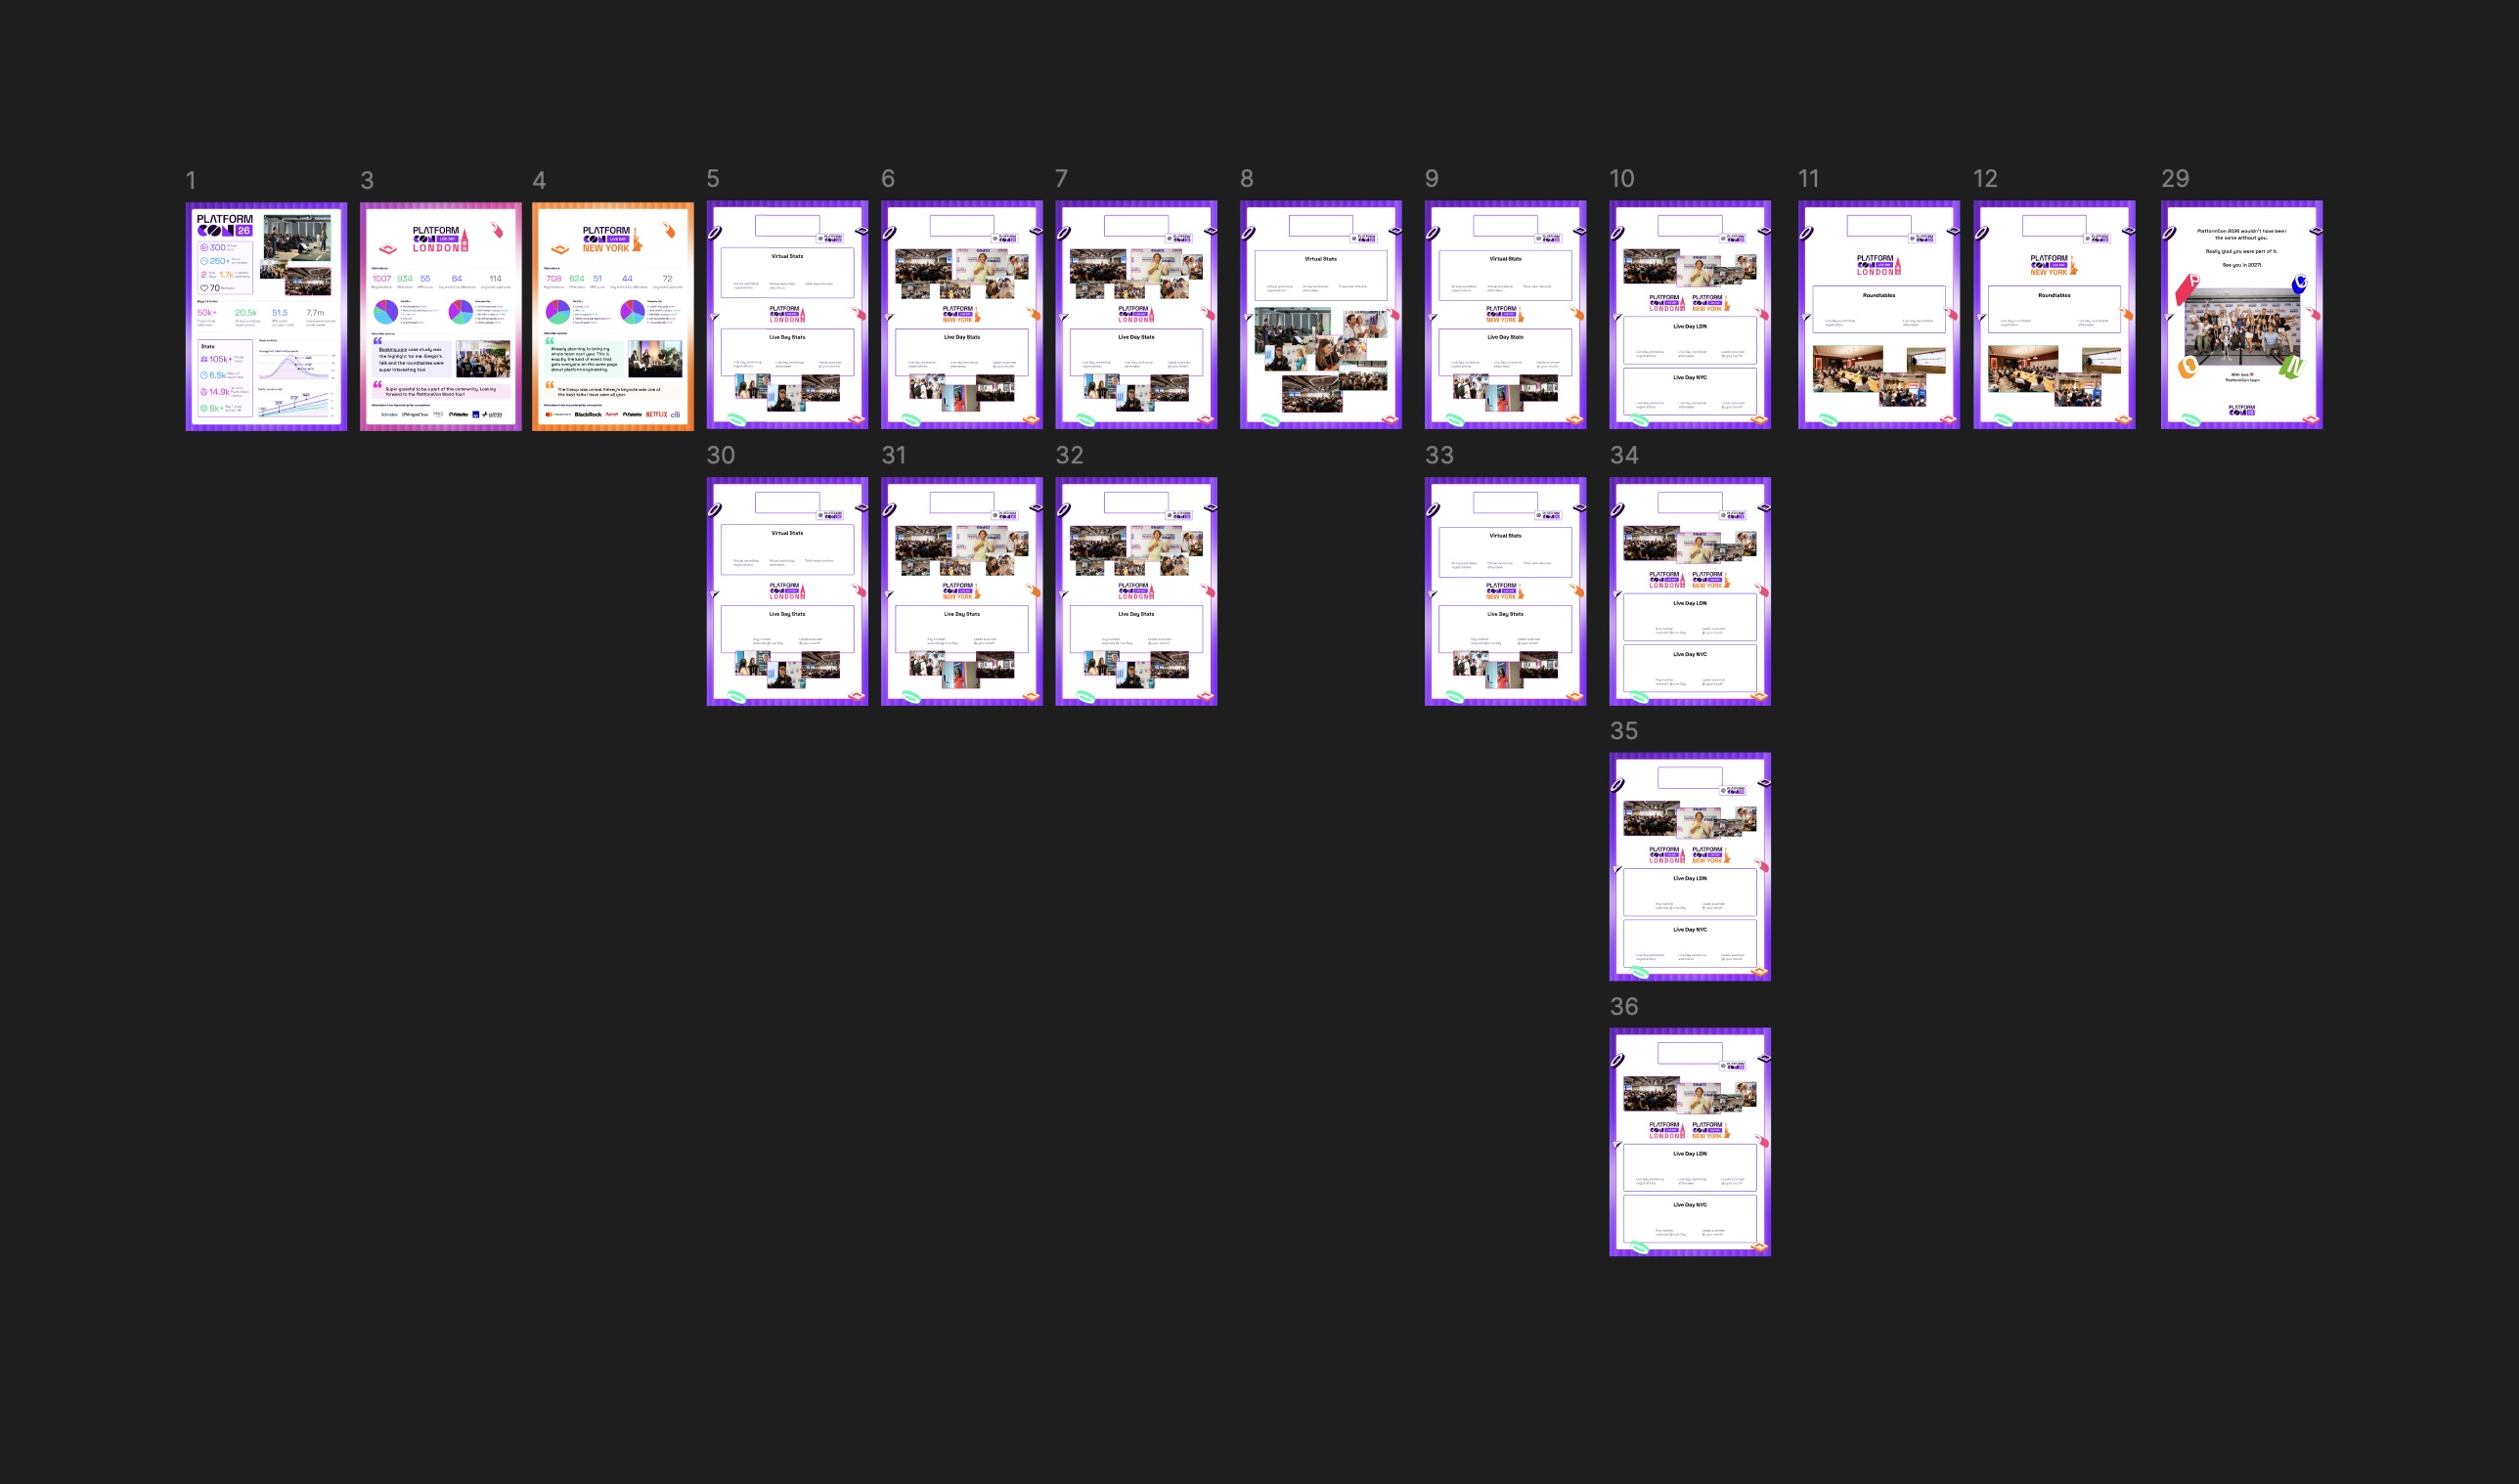
After every PlatformCon, we have to produce personalized recap reports for each sponsor. Each report covers what that sponsor actually did: virtual workshops, live day booth presence, roundtables, across different cities. Doing it manually takes hours of copy-pasting and it’s easy to get things wrong. So this year, we automated it.
The sponsor reports were actually the final boss of a much bigger effort. PlatformCon 2026 needed thousands of design assets, all repetitive, all built from a handful of Figma templates: speaker cards, OG images, social graphics, video backgrounds. We ended up generating 2,000+ assets across different formats without anyone manually touching Figma. That system grew into its own tool, Design Clanker, which we’ve since made open source. You can learn more about the project at designclanker.com.
This post is about the one use case that pushed the system hardest: the sponsor PDFs.
The Problem
PlatformCon 2026 ran across three formats: a global virtual conference, a live day in London, and a live day in New York. Sponsors could join any combination of these, and their reports needed to show exactly what they participated in.
A sponsor who ran a virtual workshop and had a booth in London needs a completely different report layout than one who only scanned leads at a booth in New York. Manually handling 14 possible layout combinations across dozens of sponsors wasn’t realistic.
The Architecture
The solution is a polling pipeline deployed on Fly.io that connects three systems:
Airtable  →  Figma  →  Airtable
(trigger)    (design)   (output PDF)
- Airtable holds all sponsor data: workshop registrations, attendee counts, booth leads scanned, roundtable figures, and a “Generate Report” trigger field.
- When a record is set to “Generate”, the pipeline picks it up, reads the sponsor’s data, and decides which Figma frames to include.
- It exports those frames from Figma as PDFs, overlays the sponsor’s actual numbers onto the design, merges everything into a single PDF, and uploads it back to the Airtable record named
SponsorName-PC26-Recap.pdf.
Smart Frame Selection with Field-Group Combos
The main engineering challenge was getting the right pages to appear for each sponsor automatically. We solved this with a declarative field-group combo system defined in a YAML config. No code changes are needed to add new combinations.
Each Airtable field belongs to a named group:
field_groups:
  virtual:
    - "Workshop registrations"
    - "Workshop attendees"
    - "Workshop view minutes"
  ldn_live:
    - "LDN Booth leads scanned copy"
    - "LDN pre-event workshop registrations"
    - "LDN workshop attendees"
  nyc_workshop:
    - "NYC pre-evnt workshop registrations"
    - "NYC workshop attendees"
A group is “active” if any of its fields has a non-zero, non-null value. Each Figma frame is then mapped to a set of require and exclude conditions:
# Frame 6 — NYC live day with workshops
- figma_frame_node_id: "7:8417"
  require: [nyc_live, nyc_workshop]
  exclude: [virtual, ldn_live]

# Frame 31 — NYC live day, booth-only (no workshops)
- figma_frame_node_id: "66:4296"
  require: [nyc_live]
  exclude: [virtual, ldn_live, nyc_workshop]
This covers 14 distinct layout combinations across 6 field groups (virtual, LDN live, NYC live, LDN workshops, NYC workshops, and roundtables) with no if statements in the application code.
Dynamic Text Overlay on Figma Exports
Figma frames are exported as PDFs at full resolution. The pipeline then uses ReportLab and pypdf to overlay the sponsor’s actual numbers onto each page, targeting specific text layers by their Figma layer name.
Layer names prefixed with # are treated as dynamic targets:
field_mappings:
  "@":                            "Sponsor label"
  "#Liveday-wr registrants":      "Avg leads captured Live Day NYC"
  "#Leads scanned at booth":      "NYC Booth leads scanned"
For frames with duplicate layer names (like the combined LDN+NYC two-column layout), we use index notation: #Leads scanned at booth[0] for LDN and #Leads scanned at booth[1] for NYC, resolved by walking the Figma node tree in document order.
Empty or zero fields render as — so the design never shows blank number slots.
Handling the Booth-Only Edge Case
Not every live day sponsor ran a workshop. Some just had a booth and scanned leads. The original three-column “Live Day Stats” design (workshop registrations, workshop attendees, leads scanned) looked broken when the first two columns were dashes.
this edge case ate a whole afternoon…We added dedicated two-column booth-only frames to Figma for each location variant and wired them into the combo system. Now a sponsor with only booth data gets a clean two-stat layout: average leads per live day and total leads scanned at their booth.
The system handles five booth-only variants automatically:
- Virtual + LDN booth-only
- Virtual + NYC booth-only
- LDN only, booth-only
- NYC only, booth-only
- LDN + NYC combined, both booth-only
Static Page Caching
The intro pages (frames 1, 3, 4) and closing page (frame 29) are the same across all reports. Exporting them from Figma on every run wastes API calls and slows things down. The pipeline caches them in memory on the first export of each run and reuses them for the rest.
When the Figma design for a static page changes, restarting the machine clears the cache and the next run fetches the updated version.
The Result
Check a box, and a couple of minutes later a personalized, multi-page, pixel-matched PDF is attached to the sponsor’s record. Dozens of sponsors, 14 possible layouts, zero manual exports. For the reports alone, that’s roughly a week of manual assembly replaced by one YAML file.
Zoom out to the whole event cycle and the math gets a bit absurd. Between speaker cards, OG images, socials, thumbnails and these reports, the system generated 2,000+ assets for PlatformCon 2026. Designing each one by hand, even at a few minutes per asset, works out to around 200 hours of manual work that simply never happened.
And when something needs to change, it’s a template edit in Figma or a line of config. Nobody waits for me. Which was the point all along: I didn’t automate the design. I automated me.
Built with Python, Fly.io, Figma REST API, pypdf, ReportLab, and Airtable.